Hi All,
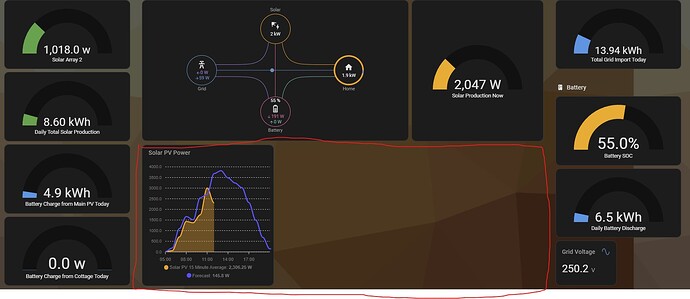
im trying to get an apexcharts card to span more than 1 card width on my dashboard but cant seem to find a way. This dashboard shows solar production today and predicted production
does any one know a way or suggest a different card than apex?
below is the code:
type: custom:apexcharts-card
update_interval: 1min
apex_config:
View_layout:
grid-column: span 24
chart:
foreColor: rgb(117, 117, 117)
height: 330px
width: 100%
experimental:
disable_config_validation: true
grid_options:
columns: 24
graph_span: 16h
span:
start: day
offset: +5h
header:
show: true
title: Solar PV Power
standard_format: false
show_states: true
series:
- entity: sensor.sunsynk_total_pv_power
color: var(–energy-solar-color)
name: Solar PV 15 Minute Average
curve: smooth
type: area
opacity: 0.4
float_precision: 2
stroke_width: 3
group_by:
func: avg
duration: 60min
fill: zero
extend_to: false
show:
in_header: false
legend_value: true - entity: sensor.solcast_pv_forecast_forecast_today
unit: W
curve: smooth
name: Forecast
color: rgb(55, 101, 252)
data_generator: |
return entity.attributes.detailedForecast.map((entry) => {
return [new Date(entry.period_start).getTime(), entry.pv_estimate*1000];
});
stroke_width: 3
group_by:
func: max
show:
in_header: false
legend_value: true
2 posts - 2 participants