@maxwroc wrote:
Long long time ago I was using Domoticz where you could easily see the usage reports from utility meters (for current day/week/month/year). Additionally you were able to compare the year over year usage. Due to lack of such functionality on HA I was hesitating from migrating from Domoticz to HA for quite a while.
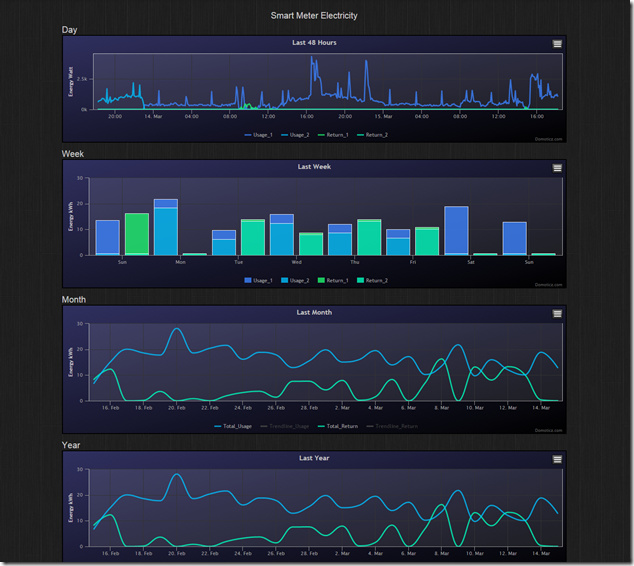
Example report from Domoticz (taken from the web - not mine):
Currently I was able to achieve weekly usage with utility meter and custom mini-graph-card (which I have contributed to by adding daily aggregation)
I was/am considering couple of solutions:
- Extending purge settings for history/recorder (currently I have set it for 14d) and just use current (above) solution to display last month
- Create a new card or extend mini-graph-card to call InfluxDB to fetch the data
- Create automation which would store the value in some DB/file. Then read the content via file platform sensor and later parse the value via some custom lovelace card (e.g. mini-graph-card)
- Create a custom integration which would be aggregating values and exposing them via single sensor
First option is not a good idea as it will just increase a lot the DB size (with really redundant data - as you cannot set retention policy per entity and I don’t want to store all sensor readings through the day for each day in the month). And it would not solve the problem of monthly aggregation (for the year).
Second option I’m not sure if it’s feasible as I don’t know if I won’t have problems accessing InfluxDB via ajax. And anyway AFAIK there is no way currently to do monthly/yearly aggregation as it’s query lang doesn’t support it. I have read that there is a way to tag the entries with some plugin for Telegraph. This way you can mark each item with day / month name / year. But this would require installing additional custom integration (telegraph) then the plugin in the telegraph for tagging… So it looks like a long and complex journey which can be blocked at some point by a random problem (so it may turn out to be just a waste of time).
Third one looks reasonable and feasible but there is a lot of custom configuration and I was wondering if there is maybe some easier solution.
The other option which I consider is to write custom integration which would do the aggregation, store the calculated values in HA DB and expose the final results as a sensor. The problem is that I’m not a Python dev and again this can take some time. It would require as well a custom card to display such data I assume.
So that is why I’m here asking if someone had similar problems and solve them somehow.
The other thing would be nice to know is how many people would be interested in such functionality (hit “like” below this post if you are).
Posts: 1
Participants: 1